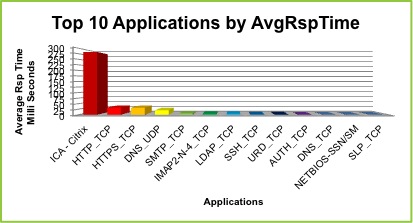
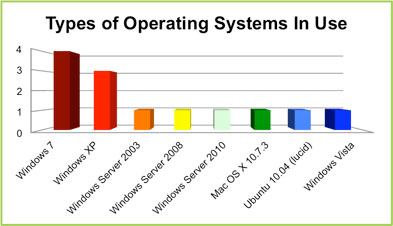
The following graph represents the Top 10 Applications by Average Response Time with Citrix being the slowest to respond. Top 10 Applications by Average Response Time The following graph represents the different types of operating systems being used. Types of Operating Systems in use
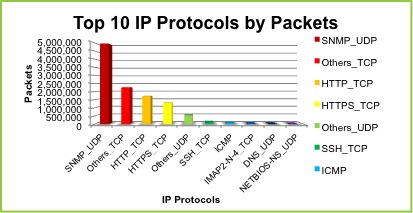
The following graph represents the Top 10 Protocols by Packets with SNMP being the Top Protocol by Packets. Top 10 Protocols by Packets
The following chart represents the estimated total capacity of the backbone traffic.
Application Percent Distribution Per Segment Number of Simultaneous Sessions Average Transaction Size Estimated Total Capacity Required
SNMP 100% 324,000/hour 74KB 52.03 Mbps
Email 100% 23/hour 1.5MB 0.08 Mbps
Backup 100% 1/hour 50GB 51,200MB 113.78 Mbps
Total 165.886 Mbps

Click HERE to return to the Case Study Page without the math.

SNMP
  • Step 1 – Determine Sessions Per Second – 324,000 / 3,600 = 90 SPS
  • Step 2 – Obtain KBps by Multiplying – 90 x 74KB = 6,660 KBps
  • Step 3 – Convert to Kilobits per second (Kbps) – 6,660 x 8 = 53,280 Kbps
  • Step 4 – Convert to Megabites per second (Mbps) – 53,280 / 1,024 = 52.03 Mbps
  • Step 5 – Repeat for all remaining applications and sum for total traffic.

Total of all Backbone Traffic: 52.03 + 0.076 + 113.78 = 165.886 Mbps


If you had a 1 Gbps backbone, it could be stated that you are utilizing almost 16.2%, which is well under the 40% maximum guideline.

KeenRevolutions. All rights reserved.
Home About Case Studies Survey Contacts